Growing number of higher educational institute in India
Higher education has a significant role in the development of a country. Higher education and overall development have the reciprocal growth within them. Higher education is known as a focal point of knowledge and its application, an institution which makes a great contribution to the economic growth and development through fostering innovation and increasing higher skills.
Higher the number of higher educational institutes represent the sustainable economic growth in the country apart from knowledge, skills and increasing number of employable professionals.
India is a knowledge centre for higher education since the beginning. In the starting era, the Indian education system was revolving around ‘Gurukul system’, which was a residential educational system. Nalanda and Takshila were the two first places where modern style universities established around 6 BC.
In the starting of 1600 AD, European rulers brought major changes in the traditional higher education system. Several renowned universities have taken place in India during colonial age. The figure below shows growth in a number of universities during the 20th century after Independence.
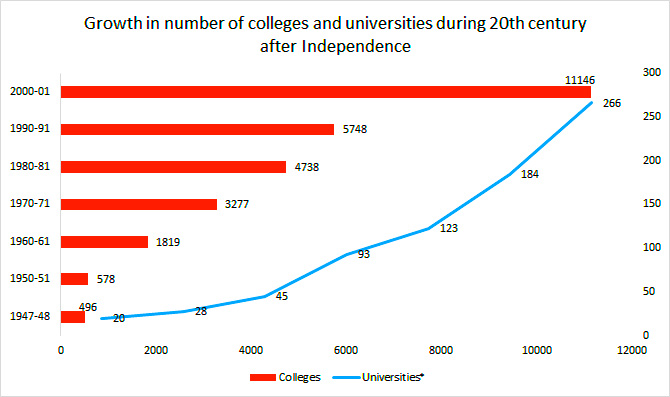
Source: (1947-48 to 2000-01). University Grants Commission
*Universities from 1947-48 to 2000-01 includes Central, State, Private and Deemed-to-be Universities as also institutions of national importance established both by the Central and State Legislatures.
At the time of Independence, India has 20 universities and 496 colleges, which have grown subsequently to 266 universities and 11146 colleges at the end to the 20th century. Up to the year 2017, there were more than 40 thousand colleges and 864 universities, which was highest in Indian educational history. In next year (2017-18), the number of colleges has reduced to 39 thousand due to deletion of unauthorized collages but the number of universities has increased again to 903 as per the AISHE report 2017-18.

Source: AISHE report 2017-18
*Number of colleges have reduced in the year 2017-18 due to deletion of all such colleges that have not registered even after getting the AISHE code.
Universities in India has further classification according to their accreditation status. As per the AISHE report, 2017-18, at present state public university (40%) has the maximum contribution followed by state private university (30%). The share of Central Universities is limited to 5 per cent only.
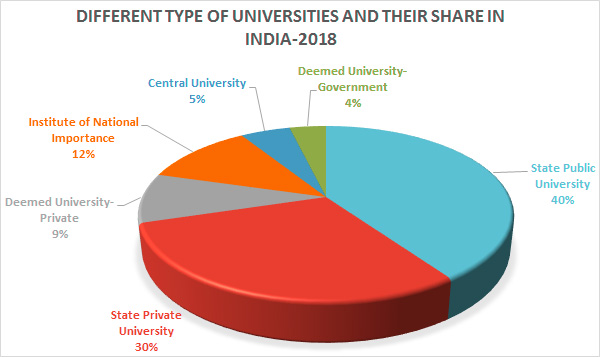
Source: AISHE report 2017-18