by ritu_jadeite ritu_jadeite No Comments

Cyber-crime cases registered in India from 2013 to 2015

Cyber-Crime cases registered in India from 2013 to 2015

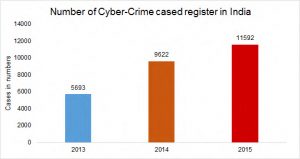
Cyber-crime achieving new heights every year in India. India has the third highest number of internet users in the world after USA and China. Register number of cyber-crime cases have increased more than 100 % from the year 2013 to 2015. Collectively, 11592 cyber-crime cases registered in the year 2015. However, a sizable number of cyber-crimes are not be registered in the absence of knowledge.

Source: Ministry of Electronics and Information Technology

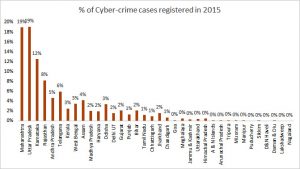
The figure below shows the percentage of cyber-crime cases registered in India. Altogether, 11592 cyber-crime cases registered during the year 2015. Majority of cyber-crime cases registered in Uttar Pradesh (19%) and Maharashtra (19%). Maharashtra has the highest number of internet subscribers in the country, as per the government of India at end of March 2016.

Source: Ministry of Electronics and Information Technology

Karnataka and Rajasthan registered 12 and 8 per cent of cyber-crime cases respectively. In West Bengal, Odisha and Kerala there were three per cent cases registered in each state. Puducherry, Lakshadweep, D&N Haveli, Nagaland, Sikkim, Manipur, Arunachal Pradesh and Goa were the state where no or a negligible number of cyber-crime cases registered in India during the year 2015.


by ritu_jadeite ritu_jadeite No Comments

Change in life expectancy rate in India from 1990 to 2016

Change in life expectancy rate in India from 1990 to 2016

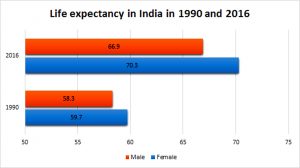
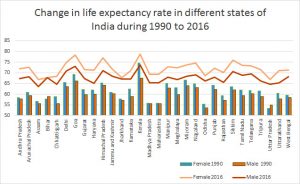
Life expectancy is the simplest way to understand the overall health outcome in a country. Increasing longevity shows the control over the longevity affecting factors such as disease or epidemic, it is the indicator of improved health facilities too. In 1990, the average life expectancy at birth in India was 59 years (male; 58.3 years and female; 59.7 years) which subsequently increase to 68.6  years in 2016, where male life expectancy was 66.9 years and 70.3 years for female.

Source: India: Health of the Nation’s States

However, a significant increase of 9.6 years have observed in the life expectancy of the country from 1990 to 2016, but life expectancy varied widely between the states of India. In 2016, the range was from 66.8 years in Uttar Pradesh to 78.7 years in Kerala for females and 63.6 years in Assam to 73.8 years in Kerala for males.

Source: India: Health of the Nation’s States

Figure above shows including Kerala, Goa, Himachal Pradesh, Sikkim and Delhi there are 12 states in which average life expectancy at birth was above 70 years in 2016. Kerala being an outperformer state since the beginning, the rate of life expectancy at Kerala was above 70 years even in 1990, where male life expectancy rate was 67.6 year and 74.5 years in female.

The average life expectancy of Uttar Pradesh and Odisha was lowest in 1990, Uttar Pradesh (65.7 years) even today unable to perform well and it is trilling in below levels with Assam (65.2 years) in life expectancy table.

by ritu_jadeite ritu_jadeite No Comments

Status of forest cover in Delhi district, India

Status of Forest Cover in Delhi-2017

Forest has paramount importance in the lives of living beings; its significance dabbles in cities. Therefore, it is essential to have a close look over the forest cover of the city. Delhi being a capital city needs to set examples for other cities in every aspect.

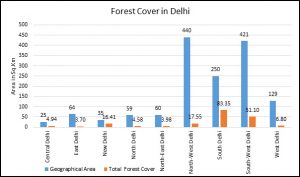
The total geographical area of Delhi city is 1483 sq.km and it has forest cover over of 192.41 sq.km as per India State of Forest Report-2017, which is almost 13 per cent.

Source: India State of Forest Report-2017

District wise distribution of forest cover reveals the clear picture of the city. South Delhi has 83.35-sq.km forest cover, which is maximum among all districts. North-West Delhi is the largest district of Delhi; it has only 17.55-sq.km forest cover.


Source: India State of Forest Report-2017

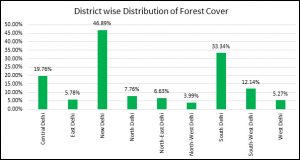
New Delhi district (46.89%) has the maximum per cent of forest cover followed by South Delhi (33.34%). North-West Delhi (3.99%) has the least per cent of forest cover among all districts. It is an urgent need to increase forest cover in entire districts except for South and New Delhi respectively.

Keeping the issue in the mind Delhi government has initiated a massive drive of tree plantation. In September 2018, the Delhi government has planted about five lakhs trees in the city. Nearly one lakh students and residents participated in the campaign at 600 locations across the city to fight air pollution.


by ritu_jadeite ritu_jadeite No Comments

Employability status in the country

Employability Status in the Country

The skill gap is one of the prominent reason behind the high rate of unemployment in India. Skills and Employability have the strong positive correlation. In recent past years, India has shown remarkable interest for skills development program to increase the employability of individuals. 

Source: India Skills Report 2018
Disclaimer: Employability Score here does not include Participation from IITs IIMs NITs and other premier institutes of the country

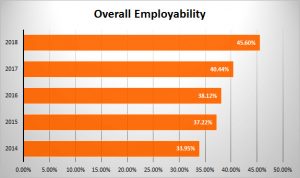
Overall employability in the country has risen from 40.44% to 45.60% over last year. As per the India Skills Report 2018, 45.60% of students are employable or are ready to take-up jobs. The data given in the report shows that in the last five years employability rate has gone up from 34% to more than 45%, which shows more availability of employable resources to the economy.

Global agencies have identified unemployment as a challenge. As per the estimation of International Labour Organization (ILO), presently 75 million young people are unemployed worldwide. The present scenario not only represent a large number of untapped talent but also shows a social unrest and individual despair.


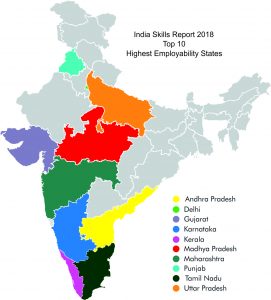
The image below shows the Top 10 highest employability states as per the India Skills Report 2018.


Image source: India Skills Report 2018


by ritu_jadeite ritu_jadeite No Comments

Pattern of using NOTA button in 2014’s general election

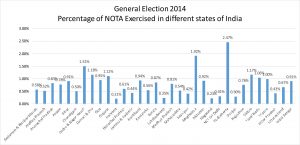
In the year 2013, the Supreme Court (SC) has given the power to reject the entire contesting candidates in the election process by selecting “None of the Above (NOTA)”. Before this, it was not in practice; elector has to select one of the contesting candidates to exercise their voting right. The power of the NOTA button was widely used in 2014, general electing of India.  Figure mention below depicts the pattern of using NOTA option during the general election of 2014 in different states of India.

Source: Election Commission of India

The electors of Puducherry (2.47%) and Meghalaya (1.92%) were the leading in pressing NOTA option during the election. Gujarat and Tamil Nadu were the large population states where NOTA option reported more than 1 per cent. There were around 18 large and small population states where NOTA button exercised between 0.5 to 1 per cent.  However, the percentage of electors opting NOTA button was significantly less but picture changed when it comes in numbers. Altogether, 55.40 lakhs voters were not convinced with any of the contestant, contested in their constituency during last general election (2014).


Number of voters exercised NOTA button iGeneral Election of India 2014

State Total Number of Electors TOTAL Number of Nota voted Total % of NOTA
Andaman & Nicobar Islands 269360 1564 0.58%
Andhra Pradesh 64934138 340554 0.52%
Arunachal Pradesh 759344 6321 0.83%
Assam 18837713 147057 0.78%
Bihar 63800160 580964 0.91%
Chandigarh 615214 3106 0.50%
Dadra & Nagar Haveli 196597 2962 1.51%
Daman & Diu 111827 1316 1.18%
Goa 1060777 10103 0.95%
Gujarat 40603104 454885 1.12%
Haryana 16097233 34220 0.21%
Himachal Pradesh 4810071 29155 0.61%
Jammu & Kashmir 7183129 31550 0.44%
Jharkhand 20349796 190927 0.94%
Karnataka 46209813 257881 0.56%
Kerala 24326650 210563 0.87%
Lakshadweep 49922 123 0.25%
Madhya Pradesh 48121301 391837 0.81%
Maharashtra 80798823 433171 0.54%
Manipur 1774369 7504 0.42%
Meghalaya 1567241 30145 1.92%
Mizoram 702170 6495 0.92%
Nagaland 1182972 2696 0.23%
NCT OF Delhi 12711164 39690 0.31%
Puducherry 901357 22268 2.47%
Punjab 19608161 58754 0.30%
Rajasthan 42994657 327911 0.76%
Sikkim 370770 4332 1.17%
Tamil Nadu 55114867 581782 1.06%
Tripura 2388822 23783 1.00%
Uttar Pradesh 138810557 592331 0.43%
Uttarakhand 7127057 48043 0.67%
West Bengal 62833113 571294 0.91%

Source: Election Commission of India

by ritu_jadeite ritu_jadeite No Comments

Speed of Business Decision Making

The most important concern for organizations today is the poor speed of decision making. Forrester Consulting and Jama Software highlight the impact in their research – “One-third of all products are delivered late or incomplete due to an inability or delay in decision-making”. Gartner attributes ‘poor speed of decision making’ as the primary obstacle hindering internal communications

These small delays, though seemly inconsequential, when compounded over a period and consisting of thousands of decisions, lead to slow and painful death of the entity – accelerated in the current disruptive marketplace that has become a reality. Forrester estimates that 48 minutes are wasted waiting on decisions for every hour that the product team spends working on the product. So in a typical 8 hour workday, wait time account for 3.5 hours. Can any entity really afford this? If we avoid delivering products late to market, think of the possibilities for savings and new opportunities that we can capitalize on.

The traditional approach of reviewing internal processes, conducting root cause analysis (RCA), identifying gaps in knowledge or competency and suggesting a definite course of action, has met with limited success. Challenge is to get people to collaborate which is related to linking strategies with execution, goals to actions.

Franklin Covey, a global leader in effectiveness training, commissioned Harris Interactive to study organizational goals and priorities by polling 11,045 adult US workers. The results were starling and plausible reasons for slow decision making. Only 44% of the workers said they clearly understood their organizations most important goals, 19% had clearly defined roles and only 9% believed that their work had a strong link to their organizations top priorities. There is a definite lack of emotional connect wherein only 19% felt a strong level of commitment to their organization’s top priorities. Also the workers don’t stay on track. Only 49% of their time is spent on activities directly linked to their organization’s key priorities while 32% is spent on urgent but less important tasks and balance 19% on petty politics and bureaucracy. Just 12% of the respondents reported monthly review of individual performance with their manager. There is a definite lack of trust and willingness to collaborate. Just 31% expressed themselves honestly and candidly at work, while a high 66% accepted that they fail to collaborate for a “win-win” atmosphere. 51% felt collective lack of focus and execution on truly important goals. (source Business Wire)

Some companies embraced purposeful collaboration using technology to streamline decision-making. They implemented advanced collaboration technologies to create review processes that work in parallel with one another, resulting in reduced waiting time. Unique opportunities for making several decisions simultaneously arose when people were brought into process earlier than the cycle. The technical solution (construct) replicated social networking design, enabling communication in real time, to manage complexity. A central repository of everything related to the product (service) facilitated faster and better decisions. Encouraging active discussions between individuals working on related parts of the product (service) led to deeper insights. It became possible to identify instances of duplicate work or other (related) teams working on something similar, creating opportunities for implementing templates for core design elements. An individual was no longer required to make decisions in isolation but encouraged to seek expert advice where required.

On the people side, it involves sharing the big picture (vision), good understanding of organization’s top goals and priorities, encouraging more problem solving where employees take initiative to seek information rather than passively sitting back waiting to be assigned their next task, and making decisions in parallel. The traditional way of linear decision becomes irrelevant in today’s dynamic environment. It creates apathetic teams inept at coping with current times where decision making needs to be trans-formative not just effective.

This is only possible when there is clarity in organizational strategy, goals and how it’s going to be executed – the role that individuals are going to play in making that a reality. Closely tied is a need to foster an environment of trust and collaboration, where one is aware of her own self and the ability to work in teams.

It is imperative that people and technology come together to produce winning solutions.

by ritu_jadeite ritu_jadeite No Comments

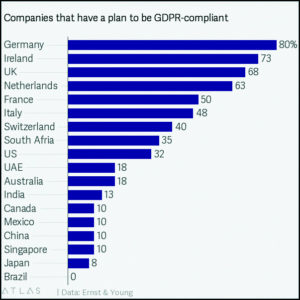
Impact of General Data Protection Regulation (GDPR)

GDPR is a regulation that requires businesses to protect the personal data and privacy of EU citizens for transactions that occur within EU member states. And non-compliance could cost the companies dearly.

When EU made the hue and cry, that’s when many people around the world realised the importance of the law. Until then, many companies in the name of collecting and storing data were passing it to their network/associations for their business connect and reach.

When the dire need to implement the law was done on 25th May 2018.  It set to force, sweeping changes in everything from technology to advertising, and medicine to banking. The big companies began to tremble and were put on focus.  Major issues were pointed on Facebook, Aadhar, Google, Apple and the likes. The law is enforced in EU, but as most of the companies have a global presence they are impacted too.

Now the people are given options to view their security information, which all apps take their personal data and also we can have a check on what’s put in to use.

India’s Vision of Data Empowerment

While many countries  (like the EU) focus on making data safer, India is trying to empower individuals with their data database –their ability to easily and quickly access, manage, and move that data. Their vision is to bring significant consumer benefits.

For example, extracting records of commercial transactions in a suitable format and sharing them with a lender can help individuals secure loans; porting data from universities to prospective employers can make applying for jobs more efficient; and a consumer may more easily adopt different technology platforms (e.g., a music service, a social network, a mobile operating system) if she can easily port data to those platforms from platforms she already uses.

Indian IT giants like Infosys, Tata Consultancy Services (TCS), and Mindtree, which service European clients, will see an outsized impact of the new regulations, smaller Indian firms aren’t immune. Be it e-commerce sites with users logging in from, say, Belgium, or an India-based e-payments gateway accessed by someone in Abroad, all companies—tech and otherwise—will need to tweak their terms and conditions to reflect the new rules.

“Digital marketing will be most affected once GDPR comes into effect, as promotional e-mails sent without the recipient’s prior consent will call for a heavy price.

Not just India but many countries in the world are working hard to get the things on track.

And as India looks at drafting its own privacy rules this year we hope new rules benefit the society and the country.  It’s the individual’s responsibility to not let go of more personal information and be aware of the consequences. Jadeite being a year old company keeps in check with the latest laws and regulations and adheres to the compliance.


by admin admin No Comments

A Project Manager’s approach to Disaster Management

A Project Manager’s approach to Disaster Management

Disaster management is a crucial component in any organizational, corporate or governmental strategic plan. It involves dealing with risks of high magnitude, which may be the result of natural or man-made disasters; and aims for capacity building in disaster resiliency and crisis response.

National Disaster Management Authority (NDMA) is an agency of the Ministry of Home Affairs established through the Disaster Management Act enacted by the Government of India in December 2005. The agency is responsible for framing policies, laying down guidelines and best-practices and coordinating with the State Disaster Management Authorities (SDMAs) to ensure a holistic and distributed approach to disaster management through the expertise of its members in areas such as, planning, infrastructure management, communications, meteorology and natural sciences. NDMC is mandated to lay down the policies, plans and guidelines for Disaster Management to ensure timely and effective response to disasters.

This looks good on paper. But whenever we have a situation like floods, drought or earthquake, the agency is conspicuous by its absence – the army is called upon to assist, while the state machinery watches helplessly. And to top it all, our most trustworthy force does not have any training in disaster management, apart from a few sessions and the ability to ‘think on the feet’.

So how can the best practices of project management salvage these situations? By applying the time tested techniques of Risk Management.

It begins with ‘Plan Risk Management’. Here we are not talking about abstract plans and detailed studies leading to analysis paralysis, but a practical approach aimed to answer a few basic questions:

  • Define approaches; tools and data sources to be used to perform risk management. A lot of research has already been done and now we can reasonably predict the likelihood of an event before it actually occurs.
  • Define when and how often risk management processes will be performed. Frankly, a lot more discipline needs to go here, so we take a holistic view rather than focus on a few parameters, and maintain a rigor of periodic review at predetermined intervals.
  • Group risk categories based on potential cause of risk. A risk breakdown structure helps identify the sources of risk. A clear definition of objectives helps chart out the action plan. We display a great focus on short-term objectives, completely ignoring the long term ones, resulting in periodic re-occurrence of calamities claiming a huge toll on life and property.
  • Define the lead; support and risk management team members for each type of activity in the risk management plan, and provides accountability by clarifying their responsibilities
  • Estimate funds required, based on assigned resources and establishes protocol for their application
  • Defining risk probability and impact helps establish objectivity in approach
  • Develop a grid for mapping the probability of each risk occurrences and its impact if that risk occurs. Risks are prioritized according to their potential implications for having an effect on objectives defined. A typical approach to prioritizing risks is to use a lookup table or a probability and impact matrix. The specific combinations of probability and impact that lead to the risk being rated as “high”, “moderate”, or “low” importance need to be set up
  • Develop a reporting formats and tracking framework within which the risk management activities are sought to be performed.

Next we need to ‘identify the risk’ and document the same in a ‘risk register’, which needs to be maintained and updated in accordance to the risk management plan outlined above. A risk register contains a list of risk identified (Cause => Event => Impact => Effect); along with list of potential responses.

This is followed by ‘risk analysis’ to ascertain the likely occurrences of risks listed in the risk register. As can be seen, this is a proactive approach rather than a reactive one – aimed at preparing before the disaster occurs, rather than reacting after the damage is done.

The most important part is ‘plan risk response’ in accordance with the broad outline laid down in the risk management plan. Strategies for negative risks or threats include Avoid; Transfer; Mitigate or Accept. Let’s take a minute to examine what this means to us.

  • Avoid: Evaluate whether the situation be avoided? A lot of natural disasters cannot be avoided while a few man-made ones definitely can. The flood situation has worsened due to depletion of green cover (trees) and human settlement in the low-lying river catchment area. We have the requisite laws in place but they have not been implemented effectively due to vested interests of a few. This may need to change for the general good of all concerned.
  • Mitigate: Can the impact be reduced? A resounding yes in most situations if proactive steps are put in place and the people responsible for implementation do their part at the apt time.
  • Accept: Currently we are forced to accept all the risks since there is very little done to ‘avoid’ or ‘mitigate’ the disasters that occur. This can be addressed proactively once the roles and responsibilities are clearly defined and adequate authority given (as per the risk management plan discussed previously) to concerned persons for delivering what is expected of them, and holding them accountable for lapses if any.
  • Transfer: we may find innovative ways to transfer the risk, though the avenues available may be very limited.

Finally, we have to ‘control risk’ which is a process of implementing risk response plans, tracking identified risks, monitoring residual risks, and evaluating risk process effectiveness on an ongoing basis.

In the words of Michael Jordan – “I can accept failure, but I can’t accept not trying”

Tags: Disaster management; Process management; Strategic planning; Risk analysis

by admin admin No Comments

Achieving Balance for Equilibrium

The old school of thought aimed at creating a measurable balance among students. Thus everyone was taught the same thing and expected to reach a preset standard. Einstein and Ramanujan amongst others faced a lot of challenge when they adopted this approach. The conventional wisdom which replaced the old school, recognized the inherent strengths of an individual, and endeavored to focus on those, rather than working on the weaknesses. But this approach has also had limited success.

We often debate between two subjects – Science and Art, assuming them to be completely different things rather than being the two sides of the same coin. It is requested from the readers to show some patience before discarding the statement entirely.

Science by definition follows logical thinking while Art is a manifestation of creativity. It is however difficult for one to exist without support of the other – for real success to be achieved in any field.

Let’s discuss about Science first. Inductive reasoning works from specific to more generic terms. It is the process of generalizing the observations into a statement (theory) which is true for a number of situations and which explains the underlying reason for the occurrence to some extent.

Deductive reasoning is the opposite and works from generic to more specific terms. It is the process of extending the theory to explain the real situations encountered. Deductive reasoning is a mechanical process while Inductive reasoning is a creative process, which cannot be automated. Inductive reasoning involves moving from “zero” to “one” (creating a new concept), while deductive reasoning involves moving from “1” to “n” (generating greater understanding of the situation)

Let’s look at Art now. Painting involves a lot of creativity, but a good artist is well aware of the logical aspects of the elements involved. For example, what kind of colors to use, usage of different paper and the brush make different effects. Absence of this knowledge would severely constrain the artist, and hamper true expression of his genius.

Cooking is another example where there is a convergence of Science and Art. The flavor and look of the recipe is indeed the creation of the cook, but he necessarily needs to understand the logical side of the elements, and why they would produce the desired result, like the degree of heat, type of heat, duration of the process, the flavor of ingredients etc.

People often describe themselves as strictly “right-brained” or “left-brained,” with the left-brainers bragging about their math skills and the right-brainers touting their creativity. That’s because the brain is divided down the middle into two hemispheres, with each half performing a fairly distinct set of operations. The brain’s right hemisphere controls the muscles on the left side of the body, while the left hemisphere controls the muscles on the right side of the human body. Winking the right eye is the work of the left side of the brain.

In general, the left hemisphere is dominant in language: processing what one hears and handling most of the duties of speaking. It’s also in charge of carrying out logic and exact mathematical computations. When we need to retrieve a fact, our left-brain pulls it from our memory.

The right hemisphere is mainly in charge of spatial abilities, face recognition and processing music. It performs some math, but only rough estimations and comparisons. The brain’s right side also helps us to comprehend visual imagery and make sense of what we see. It plays a role in language, particularly in interpreting context and a person’s toneThe brain carefully balances and assigns control of certain functions to each side – it’s nature’s way of ensuring that the brain ultimately splits up tasks to maximize efficiency. Most people are right-hand dominant, which is actually controlled by the left side of the brain.

Nature has a way of giving us a lead in some areas, while leaving a lag in other, thus creating a goal to be achieved by the specific individual. It is essential for the individual to overcome that disadvantage to achieve equilibrium, and be what he/she is meant to be, while at the same time improving his areas of strength. An important thing to note is that balance or equilibrium is unique for each individual, and cannot be compared with that of another individual. Thus an equilibrium point for one (say A) may not be the equilibrium point for another (say B).

It is essential for an individual to logically assess oneself for where he is (current status), the balance that can be achieved (goal setting), and the path that needs to be covered (gap analysis). Good mentors provide invaluable advice, as it is extremely difficult for anyone to assess their own self, or to see what one is truly capable of achieving.

Harmony and balance are omnipresent. The journey from a seed to a tree is fraught with challenges, uncertainties – some within control while others outside the circle of influence, yet in some way, it is dependent on the entity in question. Nature has its own unique way of giving an advantage, as well as setting a goal that needs to be achieved.

Let’s commence our journey towards our balance – to achieve our equilibrium point, and be what we are meant to be.

Tags: Strategic planning; Deductive reasoning; Inductive reasoning