Status of households in Delhi
A housing unit is an essential dream of any family, after food and clothing, it is the most desired thing for humans. Rapid urbanization already ignited the process of migration; people are attracted towards the urban centres in the search for better employment opportunities, education and health service.
Natural growth and migration from different states to Delhi, changing the demography of both the places, which leads the shortage of housing in urban centres. Delhi is the most densely populated state in India, on average 11,320 people (2011) living in a square kilometre area.
As per the Census of India- 2011, 1.68 crores, people are living in more than 33 lakh households in Delhi. Out of which 98 per cent households were, urban and only 2 per cent was rural.
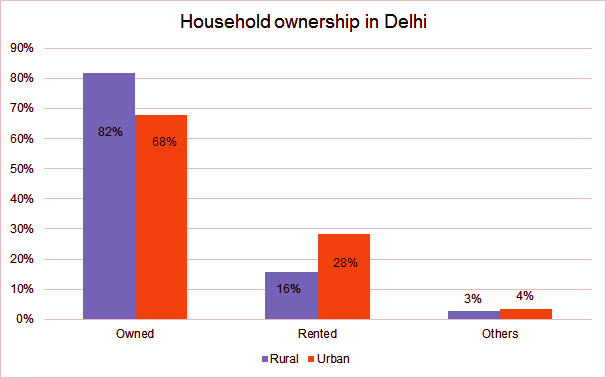
Figure 1
Sources: Census of India 2011
Figure 1 shows that the majority of households in rural areas owned by the dwellers, only 16 per cent of household dwellers were living in a rented house. Household ownership picture significantly changes in urban areas where 68 per cent of households owned by dwellers and 28 per cent living in a rented house.
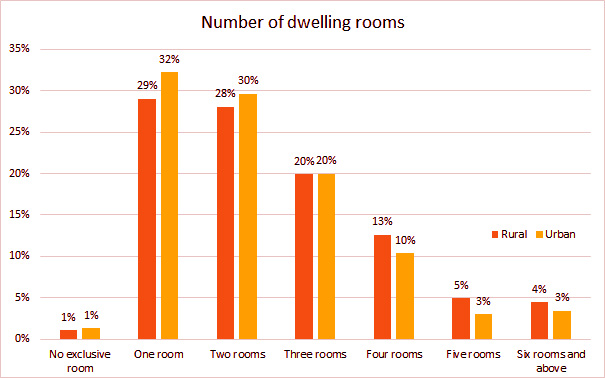
Figure 2
Sources: Census of India 2011
Not many differences observed in the number of dwelling rooms in the urban and rural area of Delhi. Figure 2 shows that around 60 % of Delhi’s families were living in one or two rooms houses. Less than 10 per cent people manage to afford five or more rooms to live in Delhi. Around a per cent households unable to afford even a single room in both the periphery.
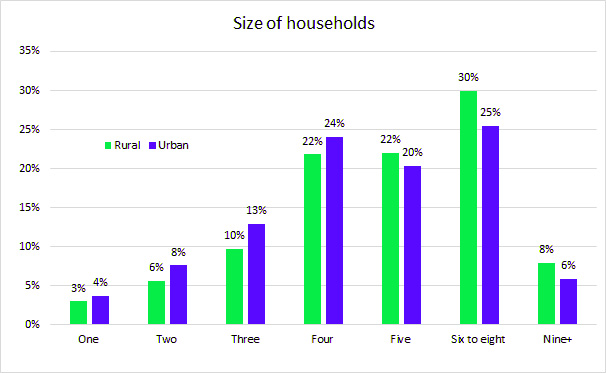
Figure 3
Sources: Census of India 2011
Figure 3 shows that about half of the households had four or five members in their families, 30 per cent of rural households have six to eight members in their families, in urban households; it is limited to 25 per cent. 3 to 4 per cent households have a single member family in both the areas.