This document takes the Delhi, India-based Digital Empowerment Foundation’s (DEF) Wireless for Communities (W4C) model as a case study to understand the legal and regulatory challenges of spectrum allocation and management, licensing regulation, and bandwidth issues in developing countries. The first section of this document maps out the common elements of these challenges among community network providers, while the next section addresses the policy, legal, licensing, and bandwidth problems in India. This document investigates the efficacy of creating wireless community networks (WCNs), Rural Internet service providers (RISPs), or Community-based Internet Service Providers (C-ISPs), and explores the possibility of policies, which could help in creating widespread information infrastructure for the country to better connect the subcontinent.
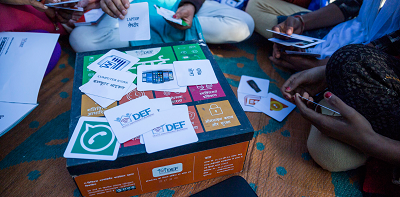
The binary Language to unbind digital literacy for illiterate
The paper is to illustrate a coming of age approach of imparting digital literacy to rural populations of the country, where traditional literacy is still lagging and where knowledge of English—a language that dominates the world of the Internet both in terms of technology and content—is rare or weak. New Delhi-based non-profit organization Digital Empowerment Foundation (DEF) has designed and developed START, a digital and media literacy learning curriculum and toolkit. This toolkit has been designed for first-generation technology users living in rural, remote and tribal parts of the country.
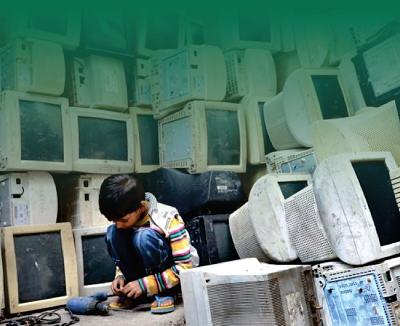
Assessing, evaluating and mapping risks involved in the informal e-Waste sector in India
The paper compares the recycling process of the informal sector with the formal sector. The paper also attempts to highlight the health and environmental issues created by the informal sector. At last, it attempts to identify a mechanism to regulate the informal sector and how it will create job opportunities if it is regulated and integrated with the formal sector. This study aims to fill this knowledge gap by presenting findings from discussions with informal sector workers, highlighting the elements for scaling up learnings and initiatives of formal-informal integration.
Barefoot women wireless engineers creating socially viable community networks in India
In this paper, we define ‘new technologies’ as technologies that are a result of the innovation of older technologies and aim at transforming lives. These technologies are often considered as threatening and unfamiliar and are often viewed as ‘unacceptable’ especially for women. However, with new sustainable innovation, technology has become an empowering agent in the lives of women, especially rural women. The paper also highlights how women have specifically understood the importance of connectivity and are building their own network. This paper also focuses on Creating ‘Community Women Barefoot Engineers’ which would mean that learning and knowledge are transferred and exchanged as women are empowered to act in a predominantly male society and venture into areas that were previously restricted for them.
Click here to download the report
Published at: OAsis, COL’s Open Access Repository
http://oasis.col.org/bitstream/handle/11599/3439/PCF9_Papers_paper_200.pdf?sequence=1&isAllowed=y

India’s most watched YouTube Channel
Last year, YouTube completed its 10th year in India crossing more than 225 million monthly active users. In the 10 years of its existence, Google owned video platform has penetrated 80 percent of India’s internet universe. In different categories of channels – music, entertainment and politics still hold the top most watched channels. Since 2008, the market of YouTube content has been changed drastically. According to Rajan Anandan, VP South East Asia, and India, Google, by 2020, India will have 650 million Internet users at current growth rate over 500 million unique users.
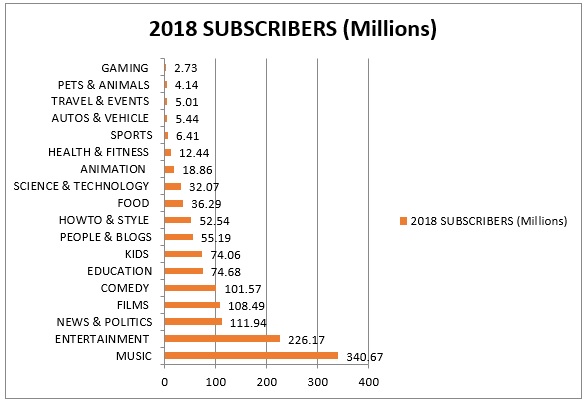
We analysed 1000 popular YouTube channels in 18 different categories, including music, entertainment, news & politics, comedy, education, science & technology, etc. Music category has the highest number of subscribers with 340.67 million followed by entertainment and news & politics with 226.17 and 111.94 million subscribers respectively. Whereas gaming, pets and animals and travel & events are the lowest categories with 2.73 million, 4.14 million and 5.01 million subscribers.
With affordable data plans, increasing penetration of smartphones along with a variety of content on YouTube, the video platform now reaches 85 percent of all highly engaged Internet users, in the 18 years and above age group in India. Analyzing further 174 YouTube under ‘Society’ category, which comprise of NGO, CSR (Corporate Social Responsibility), governmental, politics and educational related channels.
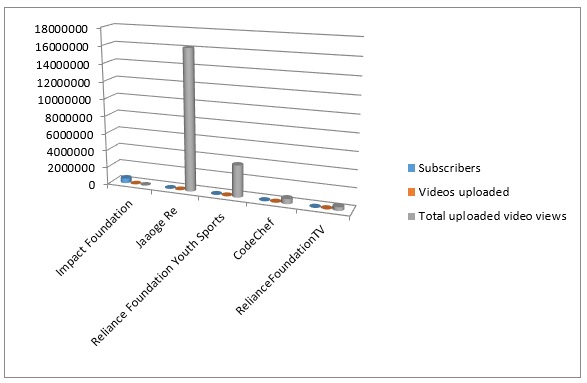
Only 5 organisational YouTube Channels under CSR sub-category have the highest number of subscribers. These organisations are analysed on based on subscribers, number of videos are uploaded and the total number of viewers. Interestingly, two of the philanthropic organisations are Reliance group.
Out of 26 NGOs, spiritual organisations – IRC TV, Isha Foundation, BAPSChannel and Gurudev Sri Sri Ravi Shankar have highest number of subscribers. Bilateral agencies like Save the Children, UNICEF India and British Council India have the highest number of subscribers after religious channels.
| YouTube statistics in India – NGO | |||
| Organisations | Subscribers | Videos uploaded | Total uploaded video views |
| IRC TV | 1475142 | 23241 | 300041024 |
| Isha Foundation | 661651 | 790 | 73160128 |
| BAPSChannel | 157034 | 2771 | 68236545 |
| Gurudev Sri Sri Ravi Shankar | 466478 | 1332 | 58139614 |
| Save the Children India | 87322 | 262 | 26641712 |
| UNICEF India | 18378 | 461 | 6636488 |
| British Council India | 57619 | 764 | 3912669 |
| HelpAge India | 8448 | 174 | 1587701 |
| TeachForIndia | 8267 | 179 | 1216930 |
| TERI | 5090 | 975 | 943589 |
| AYUSH Adivasi Yuva Shakti | 2233 | 182 | 657924 |
| Greenpeace India | 2356 | 272 | 545548 |
| SOS Children’s Villages India | 708 | 61 | 515656 |
| JoinHandsForChange | 348 | 37 | 433383 |
| Infosys BPM | 735 | 55 | 266297 |
| Infosys Finacle | 2380 | 131 | 140578 |
| Amnesty International India | 1305 | 163 | 137159 |
| savethechildrenind | 85 | 67 | 26581 |
| Buzz India | 127 | 54 | 25715 |
| WorldVisionIndia | 140 | 3 | 9896 |
| The Story Of | 0 | 20 | 8528 |
| Infosys InStep | 153 | 2 | 7602 |
| Infosys Consulting | 89 | 34 | 6285 |
| Infosys Foundation | 122 | 30 | 5914 |
| KHUSHII NGO | 28 | 3 | 687 |
| SmilingStart | 2 | 3 | 283 |
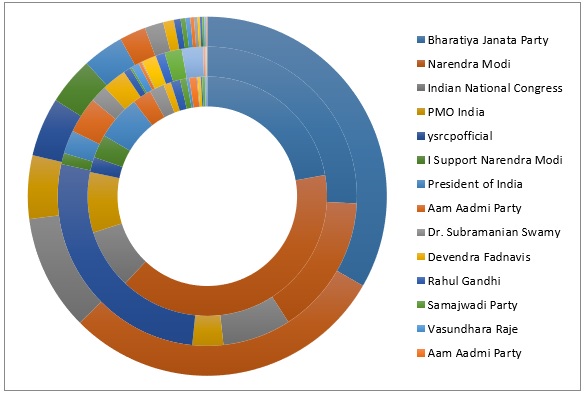
Similarly, out of 24 channels of political party and people, BJP, Narendra Modi and India National Congress have the highest number of total uploaded video views. There are also YouTube channels like ‘I Support Narendra Modi’, ‘CMO Gujarat’, ‘With Congress’ and ‘Namma Congress’ are also in list of most watched YouTube Channels, even though number of videos are lesser in number than others.
In India, YouTube is seeing incredible growth across all age groups, even amongst 55+ audience our reach stands at over 80%. It represents an incredible opportunity for brands to use that Intent to connect with their audience in a meaningful way and drive significant business results.
Tribal Health in India
Tribal Health in India
by Dr. Sunil Kumar
Tribal population is an important segment of India’s population living in different parts of the country. One-third of the world’s tribal and indigenous population, which is, more than 104 million tribal population live in India (Census 2011). Perhaps, they are the only native inhabitants of in the country.
There are 705 different tribes, which constitute 8.6 per cent of the total country’s population. Odisha has the largest number of notified Scheduled Tribe (62), followed by Karnataka (50) Maharashtra (42) and Madhya Pradesh has the 4th place with 43 notified tribes.
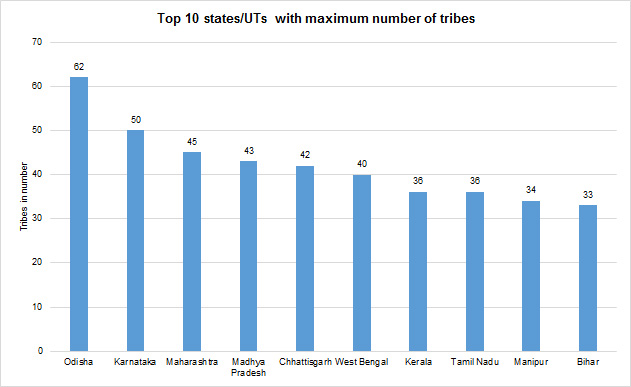
Figure1
Source: Report of the High-Level Committee on Socio-Economic, Health and Educational Status of Tribal Communities of India 2014
As far as concentration of ST population is concerned, Madhya Pradesh has 14.7 per cent (over 153 lakh) of total ST population, which is the largest concentration of ST population in terms of numbers in any Indian state, followed by Maharashtra (over 10 million), Odisha and Rajasthan (over 9 million each).
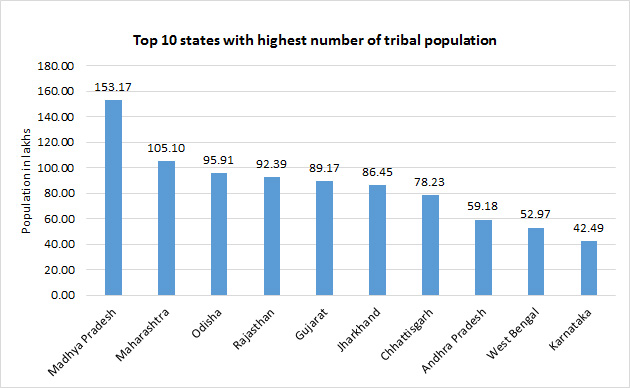
Figure 2
Source: Report of the High-Level Committee on Socio-Economic, Health and Educational Status of Tribal Communities of India 2014
The concentration of tribal population mainly located in different regions in the country. Predominantly, it was highly concentrated in North-Eastern region apart from the numbers, Mizoram has 94.43 per cent tribal population in the state, followed by Nagaland (86.47%), Meghalaya (86.14%) and Arunachal Pradesh with 68.78 per cent tribal population.
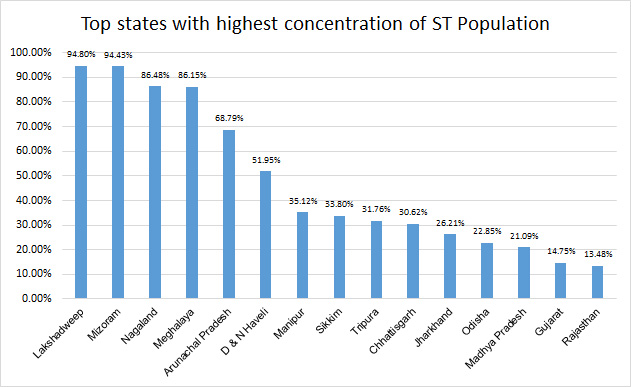
Figure 3
Source: Report of the High-Level Committee on Socio-Economic, Health and Educational Status of Tribal Communities of India 2014
However, Lakshadweep was leading in tally with 94.80 per cent tribal population but its actual representation is less than 65 thousand in numbers, whereas Mizoram’s tribal population was more than 10 lakhs.
Tribal Health
Tribal people in India commonly called as Adivasi, the term Adivasi made up from two words Adi (from the beginning) and Vasi (inhabitant), derives from the Hindi, which means a set of people or group living from the beginning. There are few other terms as Vanavasi (“forest dwellers) or Girijan (“hill people”), by which tribal people identified.
The above terms to tribal population given on the bases of their primitive existence and geographic location of inhabitation. Forest and hilly region are the favourite place for the tribal population; they largely associate with forest ecosystem and try to fulfil their need and requirement within the same. Out of total tribal population (104.30 lakhs), only 10.03 per cent living in urban area, an overselling majority of the tribal population (89.97%) still living in the rural and remote periphery, as per Census, 2011.
In many ways, the tribal population in India struggling with many development indicators. Altogether, 40.6 per cent ST population lived below the poverty line as against 20.5 per of the non-tribal population in the county, by and large poverty is main obstacle to get quality health services, accessibility to health services are second. Tribal population largely filed to manage at both the fronts.
Health Indicator among tribal population
Largely, statistics on the health conditions of different tribal communities are not available, whatever the data available evidencing the health status of Scheduled Tribes is available at the aggregate level.
IIPS conducted a study, in which they estimated the life expectancy of the tribal and non-tribal population in India, shows ST population in India has 63.9 years, as against 67 years life expectancy for the general population. The Rapid Survey on Children 2013-14 reveals that more than 30 per cent ST women get married before they turn 18. It is much noticeable that near about 50 per cent adolescent ST girl (between 15 to 19 years) are underweight and high prevalence anaemia cause to death for 17 to 46 per cent of maternal cases deaths. According to NSSO 2014, 27 per cent of tribal women still delivers at home, which is the highest among all population group.

Figure 4
Source: Tribal Health in India-2018
Figure 4 shows, 40 per cent illness happen to tribal population due to some or other type of infection, followed by respiratory diseases (18 %), Non-communicable and Musculoskeletal diseases (10 % each). Mental illness and neurological disorder (5%) also increased significantly in the tribal population.
Malaria usually transmitted the bite of an infected Anopheles mosquito and it is a life-threatening disease. The 20 per cent of country’s population living in tribal, hill, hard-to-reach or inaccessible areas, constitute almost 80 per cent of malaria case. India accounts for 8 per cent of the tribal population and contributes to 30 per cent of malaria cases.
Animals Attacks
As, it is already discussed in the inception of tribal health that they are inherently habitant of the forest ecosystem, where chances to conflict with the animals are always higher. India has highest snakebite mortality in the world, which is between 45 to 50 thousand annually or about 125 people per day.
Health infrastructure
In India, there are 0.7 physicians per thousand people and a majority of the Indian need to travel about 20 km to access the services of the hospital. As per the Ministry of Health, there are around 6 to 6.5 lakh medical practitioners available in India, which need to be double by 2020 to maintain the required ratio of one doctor per thousand population.
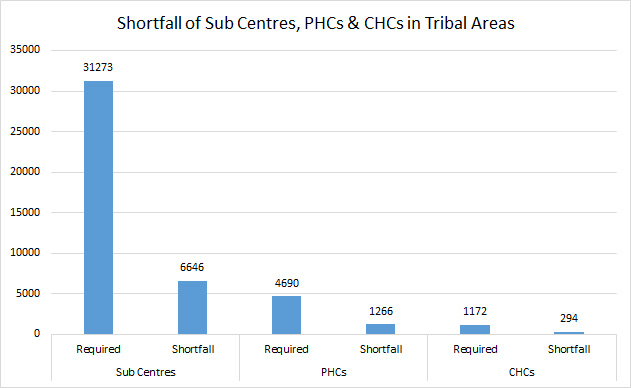
Figure 5
Source: Rural Health Statistics 2017 as analysed by NHSRC
*Shortfall means ‘required’
Figure 5, shows that there is a shortfall of 6646 sub-centres in tribal areas across the country. More than 12 hundred PHCs need to establish and at least 300 other CHCs will be helpful to cater the need tribal population in India.

Figure 6
Source: Rural Health Statistics 2017 as analysed by NHSRC
*Shortfall means ‘required’
As far as a shortfall of human resources is concerned, figure 6 shows that there were 85 per cent specialists lacking at CHCs in tribal areas until the year 2007, which is not decreased much (82.30%) in 2017. The need for specialists at CHCs almost similar across India during the year 2017. There was a need of 50 per cent Staff Nurses at PHCs and CHCs in 2007 in tribal areas, which subsequently reduced to 27.90 per cent. In the corresponding category, they need 20.20 per cent of staff nurses in all India in 2017.
As per the Report: Tribal Health India-2018, following ten burdens of tribal health in India
- Communicable diseases, Maternal and child health problems and malnutrition continue to prevail
- Non-communicable diseases including mental stress and addiction are rapidly increasing
- Injuries due to accidents, snake and animal bites and violence in conflict situations
- Difficult natural conditions arising due to geographic terrain, distances and harsh environments
- Worse social-economic determinants, especially in education, income, housing, connectively, water and sanitation
- Poor quality and inappropriate health care service with low access and coverage, low output and outcomes
- Severe constraints in health human resources at all levels; the professionals from outside are unwilling to serve in tribal areas, and the local potential human resources are not trained and utilized by the health system.
- The legitimate and needed financial share for tribal health not allocated or used in most of the states. There is a lack of transparent accounting of the actual expenditure of tribal health.
- Lack of data, monitoring and evaluation that masks the above-mentioned problems.
- Political disempowerment of tribal people from the individual to the national level that exacerbates these problems. There is little inclusion of tribal people in the planning, priority setting and in execution.
CSR funds and social development in India
CSR funds and social development in India
The roots of Corporate Social Responsibly (CSR) are much deeper than the inception of section 135 of the Companies Act, 2013, which known as Corporate Social Responsibility Policy. This act governed to certain companies, which qualify to such conditions as mentioned under Sub-Section 1 of Section 135 to comply mandatory Corporate Social Responsibility to solve India’s complex issues of development.
The term ‘CSR’ can also be understood as a corporate initiative to assess and take responsibility for the company’s effects on the environment and the impact on social welfare. CSR should not be seen as a charity or mere donations, it is also a way of conducting business by which an organization understand and evolved its relationship with stakeholders for the common good, and demonstrate its commitment by adopting appropriate business process and strategies.
CSR applicable for the companies, whose;
- Net worth of INR 500 crore or more
Or
- Turnover of INR 1000 crore or more
Or
- Net Profit of INR 5 crore or more during any financial year
As per the data available on the website (https://csr.gov.in/CSR/) designed to disseminate Corporate Social Responsibility related data and information filed by the companies registered with it, shows that rupees 13465 crores spent during the year 2016-17 on different developmental projects under CSR head. This amount was less 901 crore which spent under same head last year 2015-16.
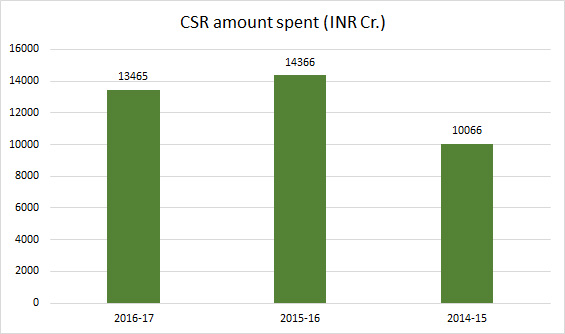
Figure 1
Source: https://csr.gov.in/CSR
As far as register companies with the website are concerned, figure 2 shows that more than 21 thousand companies were registered with portal during the year 2015-16 which subsequently declined to around 20 thousand companies in next financial year.
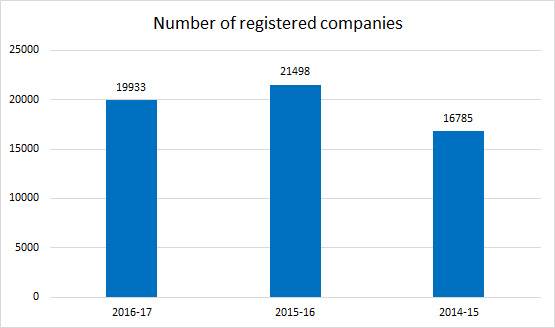
Figure 2
Source: https://csr.gov.in/CSR
Out of total register companies (19933) to the portal, only 12 per cent (2347) companies are listed and available of trade on the stock exchange. There are a majority of companies still unlisted to stoke exchange and contributing to CSR funds.
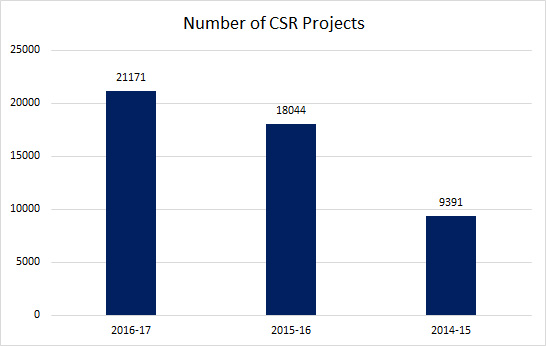
Figure 3
Source: https://csr.gov.in/CSR
Figure 3 shows, more than 21 thousand CSR projects were running in different states and UTs in India under 29 different development section during the year 2016-17. Despite decreasing spent CSR and registered companies, the number of running CSR project regularly increasing every financial year. This clearly shows, the projects are unentrapped in the development sector and have significant liquidity in the sector.
The finance minister of India, Mr Arun Jaitley himself announced recently that CSR funds worth rupees 8,314 crores remained unspent over three financial years.

Figure 4
Sources: https://www.financialexpress.com/economy/corporate-social-responsibility-csr-funds-worth-rs-8314-cr-remained-unspent-over-three-financial-years/1417941/
He disclosed that in 2014-15, the prescribed CSR amount was Rs 15,251.32 crore but Rs 5,185.39 crore remained unspent. In 2015-16, the figure was Rs 15,256.20 crore whereas Rs 889.91 crore was not spent, the data showed. In 2016-17, the prescribed amount was Rs 15,705 crore, while Rs 2,238.78 crore remained unspent.
Top CSR contributors of India
India has a vast network of companies that are working in different domains nationally and internationally. It is also important to analyze CSR contribution company wise figure 5 shows that Reliance industries were on the top for CSR contribution with 649.26 crores followed by Oil and natural gas corporation (504.91 cr.) and TCS.
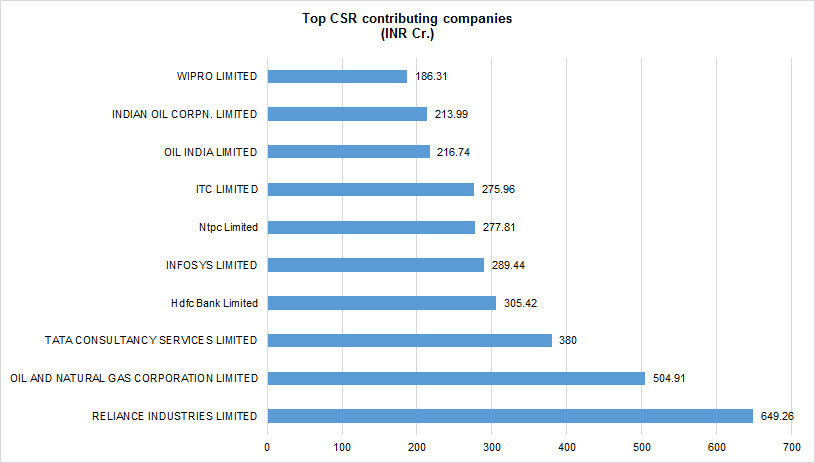
Figure 5
Source: https://csr.gov.in/CSR
Details of spent CSR amount (development sector wise) for 2016-17 given in figure 6, which shows that 38 per cent of national CSR amount spent for education, differently abled and livelihoods programs. Second highest development sectors are health, eradication hunger, poverty and malnutrition where 25 per cent of CSR amount spent to run the different development programs. There were 11 per cent amount specifically spent on rural development programs. However, Clean Ganga fund is showing zero per cent in respect to the total amount, but rupees 24 crores were spent for this initiative during the year 2016-17.

Figure 6
Source: https://csr.gov.in/CSR

Only altruistic surrogacy legal in India
Only altruistic surrogacy legal in India
Growing instances of infertility among couples encouraging them to explore other options (medical and non-medical) to have a child. One out of every six couples is dealing with the issue of infertility due to various reasons as per the Indian Society of Assisted Reproduction. In India, approximately 27.5 million couples are suffering from infertility who are trying to conceive.
Increasing instances of infertility rate and medical advancement paved the way to surrogate mothers or surrogacy. The word ‘surrogate’ means ‘substitute’, surrogate-mother described as an arrangement where a woman (the surrogate mother) agrees to become pregnant and bear a child for another person or persons (the commissioning parents) to whom the custody of the child will transfer directly after birth.
Surrogacy flourished as a multi-million-dollar industry in India attracted couples dealing with infertility across the word, the absence of defined surrogacy law and cheap medical treatments helped this industry to flourish most in India.
A study conducted by Centre for Social Research entitled ‘Surrogate Motherhood Ethical or Commercial’ says that majority of surrogate mothers were working as house-maids or domestic helper and earring rupees 1000 to 3000 per month, living in a nuclear family in a rented house. These statistics clearly indicate that poverty and low earning capacity are the driving factors for women to commercial surrogacy.
In many views, surrogacy is similar to baby selling and that a law comparable to the one prohibiting the sale of human organs should apply to the sale of childbearing. The unregulated surrogacy explored many dark sides of surrogacy and it is another form of slavery.
Keeping the consequence and possible threats of commercial surrogacy in mind, which potently harmed the rights of poor women and forced them for surrogacy, a surrogacy (Regulation) Bill proposed in 2016 and passed in 2018.
Salient points of surrogacy (Regulation) bill 2016
- As per the passed bill, only Indian couples, who have been married for at least 5 years can opt for surrogacy, provided at least one of them have been proven to have fertility-related issues.
- Only close relatives, not necessarily related by blood, will be able to offer altruistic surrogacy to the eligible couples.
- A woman can become a surrogate mother only for the altruistic purpose and under no circumstances, she will be paid for it, although payment can be made towards medical expenses.
- Commercial surrogacy, abandoning the surrogate child, exploitation of surrogate mother, selling/import of human embryo have all been categorised as violations that are punishable by a jail term of at least 10 years and a fine of up to Rs 10 lakh.
- Surrogacy clinics will be allowed to charge for the services rendered in the course of surrogacy, but the surrogate mother cannot be paid.
- The new Bill has put a complete ban on commercial surrogacy.
- It also bans unmarried people, live-in couples and homosexuals from opting for altruistic surrogacy. Now, foreigners, even Overseas Indians, cannot commission surrogacy.
- Surrogacy regulation board will be set-up at both Central and State-level.
- The law will be applicable to the whole of India, except for the state of Jammu and Kashmir.
- All Assisted Reproductive Technology (ART) clinics will need to be registered.
- The surrogate child will have the same rights of as that of a biological child.
Status of disabled persons in India
Status of disabled persons in India
Since 1992, 3 December know as International Day of Persons with Disabilities (IDPD) around the world. As per world report on disability (WRD) 2011, more than 100 crore persons have some form of disability in the world, which translate to about 15 per cent of the world’s population.
Disability status in India
In India, about 2.68 crore persons are disabled which is 2.21 per cent of the total Indian population as per Census of India, 2011. Out of total disable persons 1.50 (56%) crore are males and 1.18 (44%) crore are females. State wise share of disabled persons illustrated in the figure below.

Sources: Disabled Persons in India- A statistical profile 2016
Figure 1
The above figure clearly indicating that Uttar Pradesh has the highest number of disabled persons (16.50% of the total disabled in the Country) followed by Maharashtra (11.05%). States like Gujrat, Tamil Nadu, Odisha and Karnataka disable percentage ranging between 4 to 5 per cent.
Disability among children
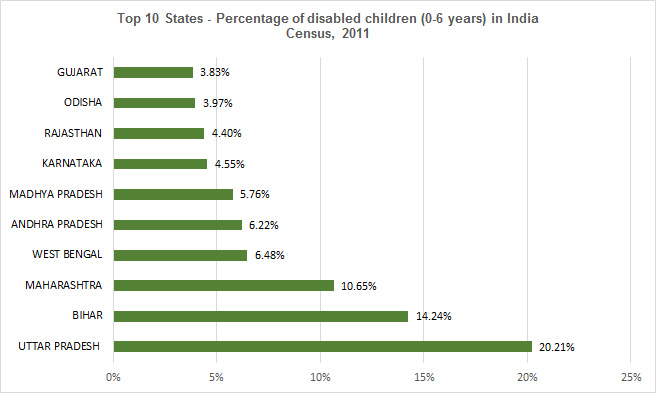
Sources: Disabled Persons in India- A statistical profile 2016
Figure 2
Above figure 2 shows the disability share (%) among children (0-6 years), it shows that Uttar Pradesh, Bihar, Maharashtra and West Bengal together contribute more than 50% of the disabled children (0-6 years) in the county. All top 10 states listed above constitute more than 80 per cent share of disabled children in India.
Working status of disable persons
Out of total disable persons 36.34 per cent disables are working in India, figure 3 shows the state wise working status of disabled persons. Nearly 50% of the disabled population reported as ‘workers’ in the states of Nagaland and Sikkim, which is the highest among all states. Whereas, states like Lakshadweep, Kerala and Delhi ranked at bottom respectively. The state with a highest disabled population (Uttar Pradesh) engaging only 34.79 per cent of the disabled population of the state, which is below to national percentage.
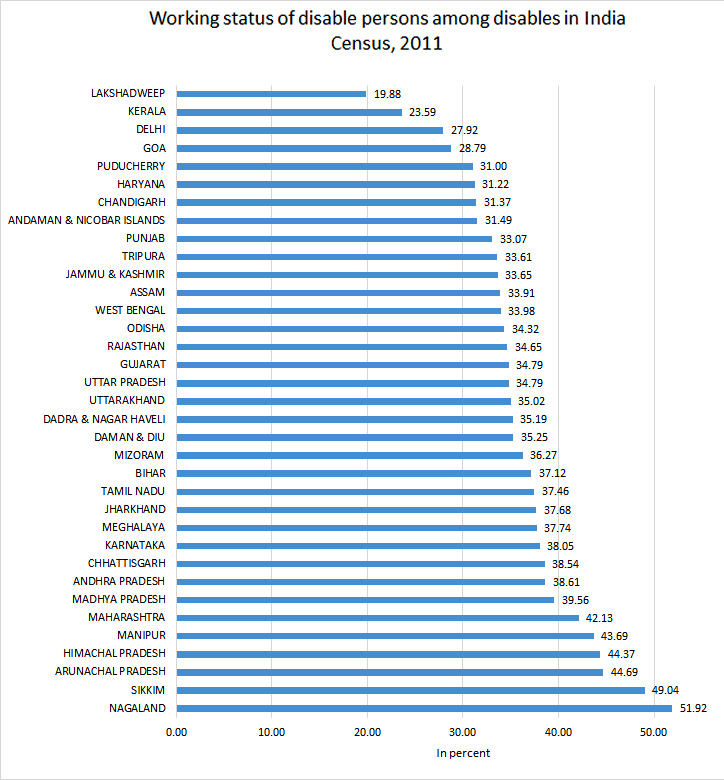
Sources: Disabled Persons in India- A statistical profile 2016
Figure 3
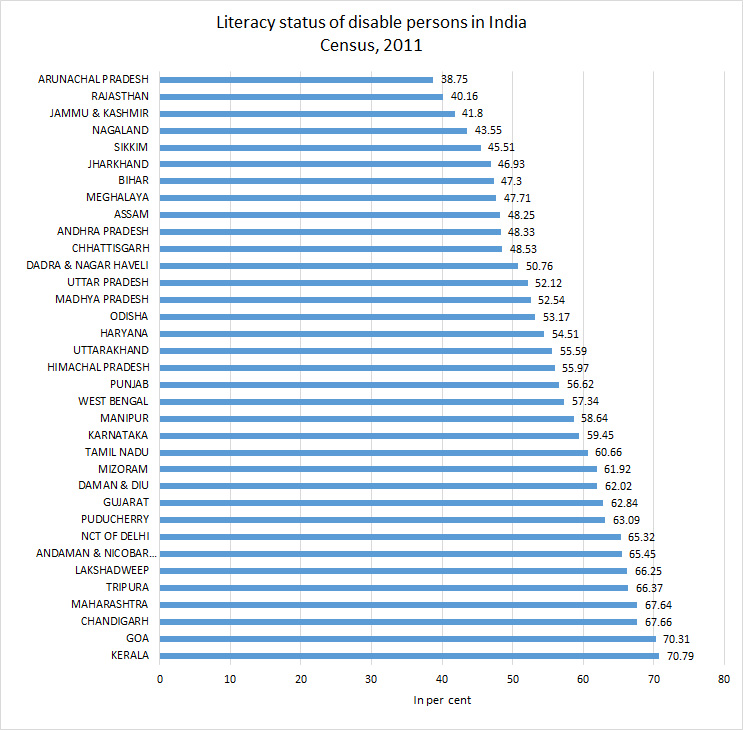
Literacy status
Figure 4 shows the literacy status of disable persons in India, it shows that Kerala and Goa have the highest literacy rate among the disabled persons (70%) and another side Arunachal Pradesh (38.75%) and Rajasthan (40.16%) reported with lowest literacy rate.